
Learning how to read charts is a basic skill in trading. A chart shows how price moves over time. It helps traders understand what the market is doing and decide when to enter or exit a trade.
In forex trading, charts are used to study price action. Instead of guessing, traders look at patterns, trends, and key levels. This makes decisions more informed and less emotional.
Key Takeaways
- Charts show how price moves over time
- Candlestick charts are the most used in forex trading
- Trends help identify the direction of the market
- Support and resistance levels show where price may pause or reverse
- Chart reading is a core part of technical analysis basics
What Does It Mean to Read Charts
Reading charts means understanding how price moves in the market. Traders use charts to study past price movements and spot patterns.
This process is part of technical analysis basics. It focuses on price instead of news or economic data. By learning how to read charts, you can better understand market behavior.
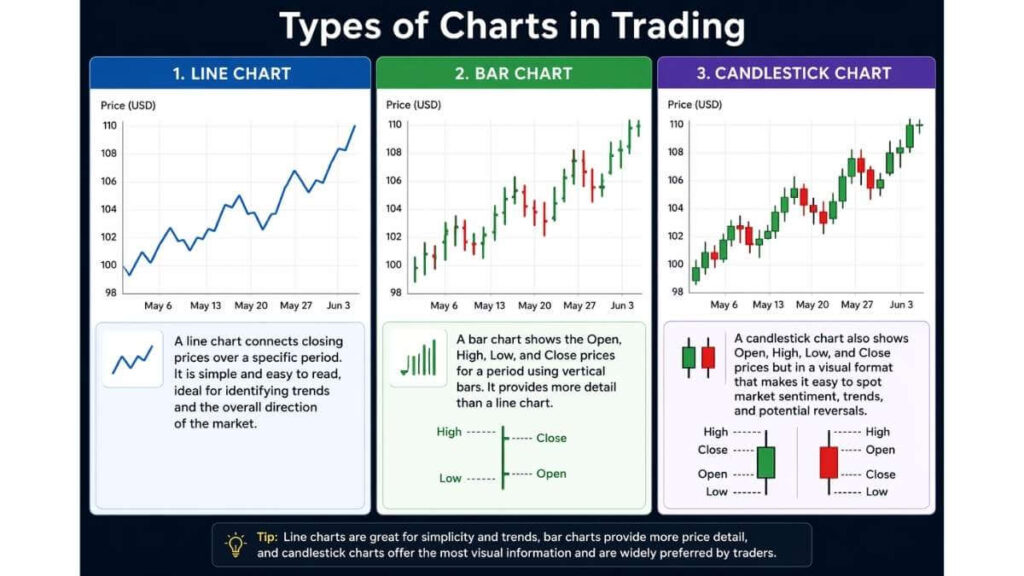
Types of Charts in Trading
Line Chart
A line chart is the simplest type of chart. It connects closing prices over time using a single line.
It is easy to read and useful for seeing the overall direction of the market. However, it does not show much detail.
Bar Chart
A bar chart gives more information than a line chart. Each bar shows four key prices
- Open
- High
- Low
- Close
This makes it more detailed, but also slightly harder to read for beginners.
Candlestick Chart
A candlestick chart is the most popular type used in trading. It shows the same data as a bar chart but in a clearer way.
Each candlestick gives a quick view of price movement. This is why candlestick chart basics are important when learning how to read forex charts.
How to Read a Candlestick Chart
A candlestick chart shows how price moves within a specific time period. Each candlestick represents one unit of time, such as 1 minute, 1 hour, or 1 day.
Learning candlestick chart basics helps you understand price behavior in a simple and visual way.
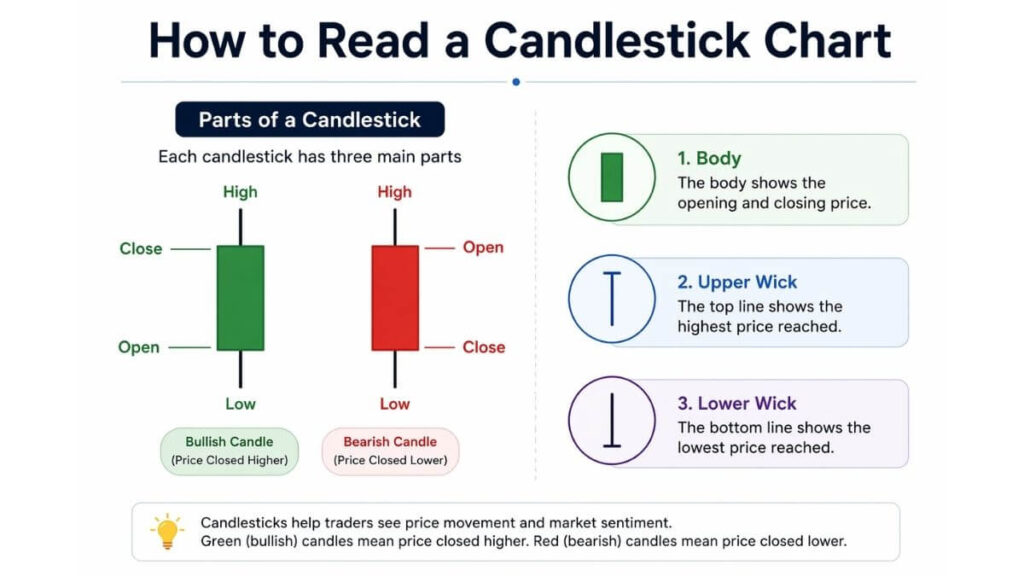
Parts of a Candlestick
Each candlestick has three main parts
- Body
The body shows the opening and closing price - Upper wick
The top line shows the highest price reached - Lower wick
The bottom line shows the lowest price reached
If the body is large, it means there was strong movement during that time. If the body is small, it means price did not move much.
Bullish vs Bearish Candles
Candles show whether price moved up or down
- Bullish candle
The closing price is higher than the opening price
This shows buying pressure - Bearish candle
The closing price is lower than the opening price
This shows selling pressure
These candles are the foundation of how to read forex charts because they show who is in control of the market.
Step by Step Guide to Reading a Candlestick
To read a candlestick clearly, follow these steps
- Look at where the candle opens and closes
- Check the size of the body
- Observe the length of the wicks
- Compare it with the previous candles
This simple process helps you understand price action basics without overcomplicating the chart.
What Candles Tell You
Candles do more than show price movement. They also show how buyers and sellers behave. This is known as market sentiment.
Strength of Movement
- A long body shows strong buying or selling
- A short body shows weak movement or hesitation
Strong candles often appear during trends, while weak candles appear during pauses.
Rejection of Price
Wicks can show rejection
- A long upper wick means price tried to go higher but failed
- A long lower wick means price tried to go lower but bounced back
This can signal possible turning points in the market.
Market Indecision
Some candles show that neither buyers nor sellers are in control
- Small bodies with long wicks show uncertainty
- Price moves up and down but closes near the middle
This often happens before a breakout or a change in direction.
Common Mistakes When Reading Charts
Many beginners make simple mistakes when learning how to read charts
- Adding too many indicators and making charts confusing
- Ignoring the overall trend
- Relying on one signal instead of confirming with others
- Trading without understanding support and resistance levels
Keeping things simple can help you learn faster.
Simple Tips to Practice Chart Reading
Learning how to read charts takes time and consistent practice. Start with candlestick charts since they give a clear view of price movement, then focus on identifying trends before moving on to patterns. Use a demo account to practice without risk, and review past charts to better understand how price behaves over time. It is also helpful to learn one concept at a time so you do not feel overwhelmed.
If you want to fully understand the basics of how to read forex charts and learn when to trade, you can register for our free courses where we guide you step by step through the entire process.